
Curve fitting widgets
Overview
The widgets.fit module provides interactive curve fitting widgets allowing:
to fit data manually (by moving sliders)
or automatically (with standard optimization algorithms provided by scipy).
The guifit() function is a factory function that returns a dialog box
allowing to fit data with a given function.
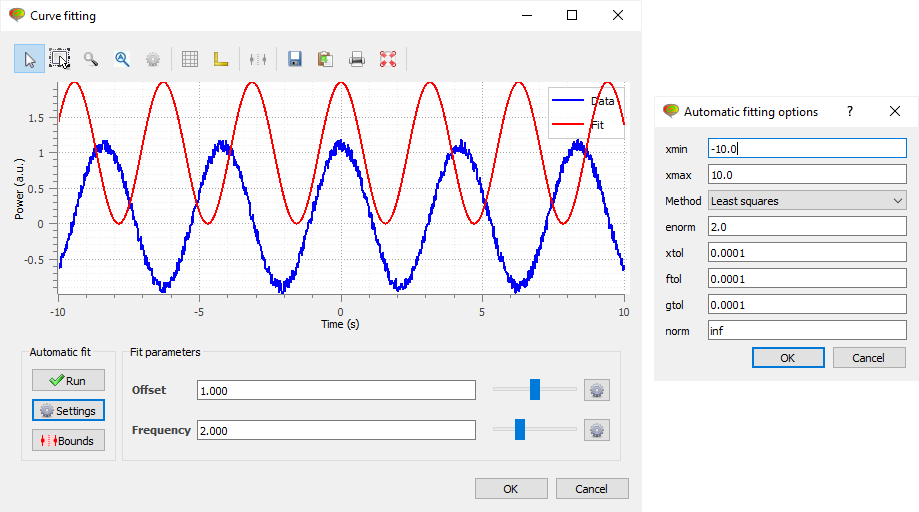
Example
Here is an example of use of the guifit() function:
import numpy as np

from plotpy.widgets.fit import FitParam, guifit


def test_fit():
    """Test the curve fitting tool"""
    x = np.linspace(-10, 10, 1000)
    y = np.cos(1.5 * x) + np.random.rand(x.shape[0]) * 0.2

    def fit(x, params):
        a, b = params
        return np.cos(b * x) + a

    a = FitParam("Offset", 0.7, -1.0, 1.0)
    b = FitParam("Frequency", 1.2, 0.3, 3.0, logscale=True)
    params = [a, b]
    values = guifit(x, y, fit, params, xlabel="Time (s)", ylabel="Power (a.u.)")

    print(values)
    print([param.value for param in params])


if __name__ == "__main__":
    test_fit()
Reference
- plotpy.widgets.fit.guifit(x: ndarray, y: ndarray, fitfunc: Callable, fitparams: list[FitParam] | None = None, fitargs: tuple | None = None, fitkwargs: dict | None = None, wintitle: str | None = None, title: str | None = None, xlabel: str | None = None, ylabel: str | None = None, param_cols: int = 1, auto_fit: bool = True, winsize: tuple[int, int] | None = None, winpos: tuple[int, int] | None = None) list[float] | None[source]
GUI-based curve fitting tool
- Parameters:
x – x data
y – y data
fitfunc – fit function
fitparams – fit parameters. Defaults to None.
fitargs – fit args. Defaults to None.
fitkwargs – fit kwargs. Defaults to None.
wintitle – window title. Defaults to None.
title – plot title. Defaults to None.
xlabel – x label. Defaults to None.
ylabel – y label. Defaults to None.
param_cols – number of columns for fit parameters. Defaults to 1.
auto_fit – auto fit. Defaults to True.
winsize (tuple[int, int] | None) – window size. Defaults to None.
winpos (tuple[int, int] | None) – window position. Defaults to None.
- Returns:
Fit parameter values or None if the user cancels the dialog
- class plotpy.widgets.fit.FitDialog(title: str | None = None, icon: str = 'plotpy.svg', edit: bool = True, toolbar: bool = False, auto_tools: bool = True, options: PlotOptions | dict[str, Any] | None = None, parent: QWidget | None = None, panels: list[PanelWidget] | None = None, param_cols: int = 1, legend_anchor: str = 'TR', auto_fit: bool = False)[source]
Fit dialog box
- Parameters:
title – window title. Defaults to None.
icon – window icon. Defaults to “plotpy.svg”.
edit – enable/disable edit menu. Defaults to True.
toolbar – enable/disable toolbar. Defaults to False.
auto_tools – enable/disable auto tools. Defaults to True.
options – plot options. Defaults to None.
parent – parent widget. Defaults to None.
panels – list of panel widgets. Defaults to None.
param_cols – number of columns for parameter table. Defaults to 1.
legend_anchor – legend anchor. Defaults to “TR”.
auto_fit – enable/disable auto fit. Defaults to False.
- set_data(x: ndarray, y: ndarray, fitfunc: Callable = None, fitparams: list[FitParam] | None = None, fitargs: tuple | None = None, fitkwargs: dict | None = None) None[source]
Set fit data
- Parameters:
x – x data
y – y data
fitfunc – fit function. Defaults to None.
fitparams – fit parameters. Defaults to None.
fitargs – fit args. Defaults to None.
fitkwargs – fit kwargs. Defaults to None.
- class plotpy.widgets.fit.FitParam(name: str, value: float, min: float, max: float, logscale: bool = False, steps: int = 5000, format: str = '%.3f', size_offset: int = 0, unit: str = '', locked: bool = False)[source]
Fit parameters
- Parameters:
name – name of the parameter
value – value of the parameter
min – minimum value of the parameter
max – maximum value of the parameter
logscale – if True, the parameter is fitted in logscale. Default is False.
steps – number of steps for the slider. Default is 5000.
format – format of the parameter. Default is “%.3f”.
size_offset – size offset of the parameter. Default is 0.
unit – unit of the parameter. Default is “”.
locked – if True, the parameter value is locked and will not be modified by the automatic fit. Default is False.
- create_widgets(parent: QWidget, refresh_callback: Callable) None[source]
Create widgets
- Parameters:
parent – parent widget
refresh_callback – callback function to refresh the plot
- add_widgets(widgets: list[QWidget]) None[source]
Add widgets
- Parameters:
widgets – list of widgets to add
