
Plot widgets
A plotpy-based plotting widget may be constructed using one of the following
methods:
Interactive mode: when manipulating and visualizing data in an interactive Python or IPython interpreter, the :py:mod`.pyplot` module provide the easiest way to plot curves, show images and more. Syntax is similar to MATLAB’s, thus very easy to learn and to use interactively.
Script mode: when manipulating and visualizing data using a script, the :py:mod`.pyplot` module is still a good choice as long as you don’t need to customize the figure graphical user interface (GUI) layout. However, if you want to add other widgets to the GUI, like menus, buttons and so on, you should rather use plotting widget classes instead of the pyplot helper functions.
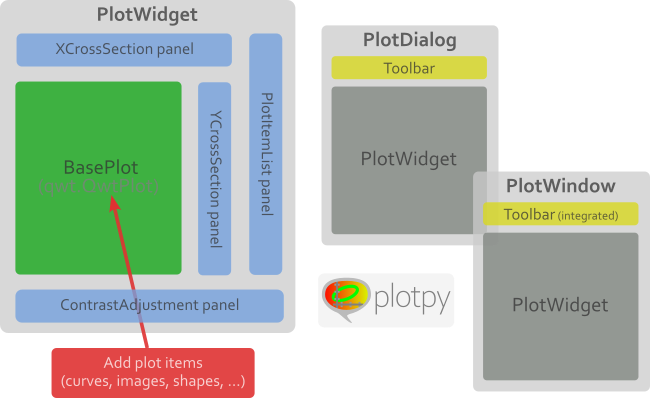
There are two kinds of plotting widgets defined in plotpy:
low-level plotting widget:
plot.base.BasePlothigh-level plotting widgets (ready-to-use widgets with integrated tools and panels):
plot.PlotWidgetand corresponding dialog boxplot.PlotDialogand windowplot.PlotWindow
Plot widgets with integrated plot manager:
See also
- Plot items
Plot items: curves, images, markers, etc.
- Plot widgets
Ready-to-use curve and image plotting widgets and dialog boxes
