Example
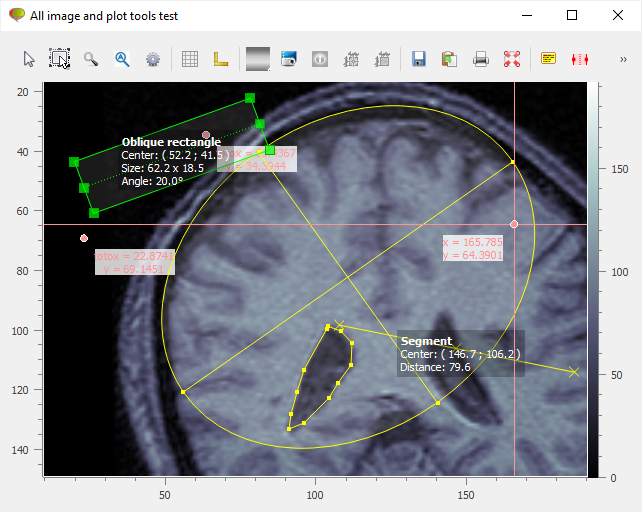
The following example add all the existing image tools to a PlotWidget
object for testing purpose:
from guidata.qthelpers import qt_app_context
from qtpy import QtWidgets as QW

from plotpy.builder import make
from plotpy.items import Marker
from plotpy.tests import get_path
from plotpy.tools import (
    AnnotatedCircleTool,
    AnnotatedEllipseTool,
    AnnotatedObliqueRectangleTool,
    AnnotatedPointTool,
    AnnotatedPolygonTool,
    AnnotatedRectangleTool,
    AnnotatedSegmentTool,
    CircleTool,
    EllipseTool,
    HCursorTool,
    HRangeTool,
    LabelTool,
    MultiLineTool,
    ObliqueRectangleTool,
    PlaceAxesTool,
    PolygonTool,
    RectangleTool,
    SegmentTool,
    VCursorTool,
    XCursorTool,
)

TOOLBAR_ID = "toolbar2"


def create_window():
    win = make.dialog(
        edit=False,
        toolbar=True,
        wintitle="All image and plot tools test",
        type="image",
        size=(800, 600),
    )
    toolbar2 = QW.QToolBar()
    win.layout().addWidget(toolbar2)
    win.manager.add_toolbar(toolbar2, TOOLBAR_ID)

    for toolklass in (
        LabelTool,
        HRangeTool,
        VCursorTool,
        HCursorTool,
        XCursorTool,
        SegmentTool,
        RectangleTool,
        ObliqueRectangleTool,
        CircleTool,
        EllipseTool,
        MultiLineTool,
        PolygonTool,
        PlaceAxesTool,
        AnnotatedRectangleTool,
        AnnotatedObliqueRectangleTool,
        AnnotatedCircleTool,
        AnnotatedEllipseTool,
        AnnotatedSegmentTool,
        AnnotatedPointTool,
        AnnotatedPolygonTool,
    ):
        win.manager.add_tool(toolklass, toolbar_id=TOOLBAR_ID)
    return win


def test_image_plot_tools():
    """Test"""
    with qt_app_context(exec_loop=True):
        filename = get_path("brain.png")
        win = create_window()
        win.show()
        image = make.image(filename=filename, colormap="bone")
        plot = win.manager.get_plot()
        plot.add_item(image)
        title = "toto"
        marker1 = Marker(label_cb=lambda x, y: f"{title}x = {x:g}<br>y = {y:g}")
        plot.add_item(marker1)
        marker2 = Marker(label_cb=lambda x, y: f"{title}x = {x:g}<br>y = {y:g}")
        plot.add_item(marker2)


if __name__ == "__main__":
    test_image_plot_tools()