Examples
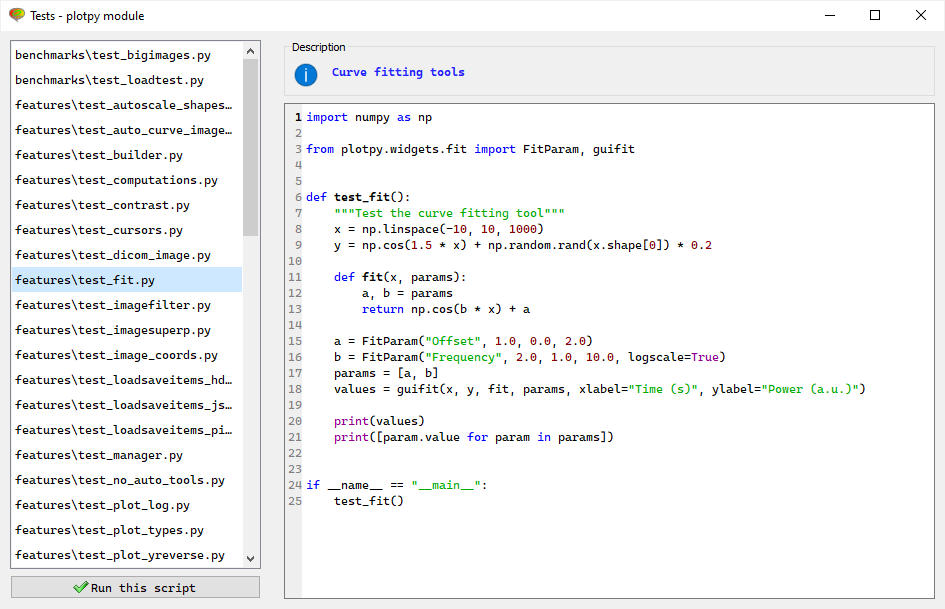
The test launcher
A lot of examples are available in the plotpy.tests test module
from plotpy.tests import run
run()
The two lines above execute the test launcher:
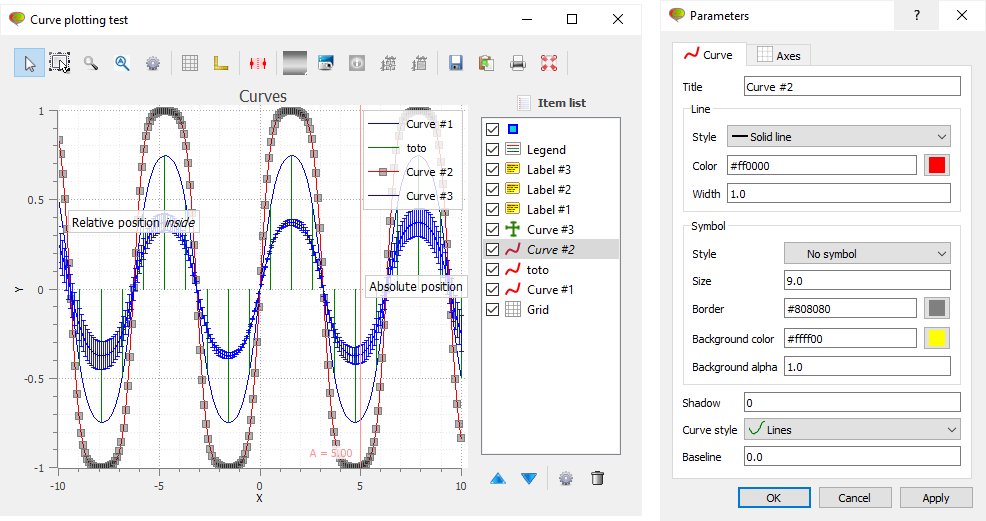
Curve plotting
Basic curve plotting
import numpy as np
from guidata.qthelpers import qt_app_context

from plotpy.builder import make
from plotpy.tests import vistools as ptv


def test_plot():
    """Curve plotting test"""
    x = np.linspace(-10, 10, 200)
    dy = x / 100.0
    y = np.sin(np.sin(np.sin(x)))
    x2 = np.linspace(-10, 10, 20)
    y2 = np.sin(np.sin(np.sin(x2)))
    with qt_app_context(exec_loop=True):
        items = [
            make.curve(x, y, color="b"),
            curve1 := make.curve(x2, y2, color="g", title="Readonly"),
            curve2 := make.curve(x, np.sin(2 * y), color="r", title="Private"),
            make.merror(x, y / 2, dy),
            make.label(
                "Relative position <b>outside</b>", (x[0], y[0]), (-10, -10), "BR"
            ),
            make.label("Relative position <i>inside</i>", (x[0], y[0]), (10, 10), "TL"),
            make.label("Absolute position", "R", (0, 0), "R"),
            make.legend("TR"),
            make.marker(
                position=(5.0, 0.8),
                label_cb=lambda x, y: "A = %.2f" % x,
                markerstyle="|",
                movable=False,
            ),
        ]
        curve1.set_readonly(True)
        curve2.set_private(True)
        _win = ptv.show_items(
            items,
            wintitle=test_plot.__doc__,
            title="Curves",
            plot_type="curve",
            disable_readonly_for_items=False,
        )


if __name__ == "__main__":
    test_plot()
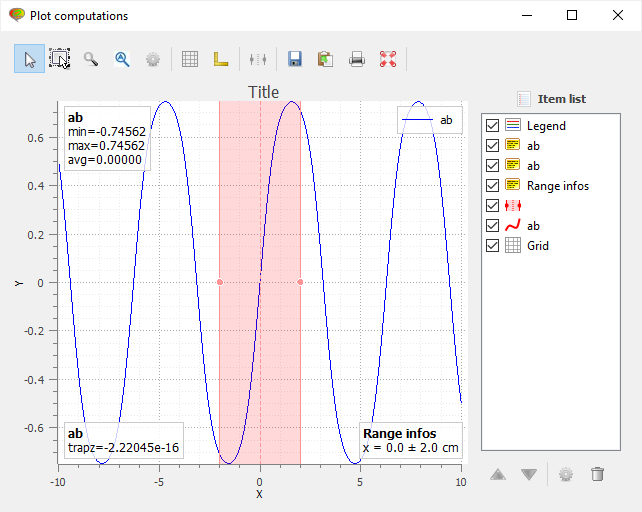
Computations on curves
import numpy as np
import scipy.integrate as spt
from guidata.qthelpers import qt_app_context

from plotpy.builder import make
from plotpy.tests import vistools as ptv


def test_computations():
    """Test computations"""
    x = np.linspace(-10, 10, 1000)
    y = np.sin(np.sin(np.sin(x)))
    with qt_app_context(exec_loop=True):
        curve = make.curve(x, y, "ab", "b")
        range = make.xrange(-2, 2)
        disp0 = make.range_info_label(
            range, "BR", "x = %.1f ± %.1f cm", title="Range info"
        )

        disp1 = make.computation(
            range, "BL", "trapz=%g", curve, lambda x, y: spt.trapezoid(y, x)
        )

        disp2 = make.computations(
            range,
            "TL",
            [
                (curve, "min=%.5f", lambda x, y: y.min()),
                (curve, "max=%.5f", lambda x, y: y.max()),
                (curve, "avg=%.5f", lambda x, y: y.mean()),
            ],
        )
        legend = make.legend("TR")
        _win = ptv.show_items(
            wintitle="Plot computations",
            items=[curve, range, disp0, disp1, disp2, legend],
            plot_type="curve",
        )


if __name__ == "__main__":
    test_computations()
Curve fitting
import numpy as np

from plotpy.widgets.fit import FitParam, guifit


def test_fit():
    """Test the curve fitting tool"""
    x = np.linspace(-10, 10, 1000)
    y = np.cos(1.5 * x) + np.random.rand(x.shape[0]) * 0.2

    def fit(x, params):
        a, b = params
        return np.cos(b * x) + a

    a = FitParam("Offset", 0.7, -1.0, 1.0)
    b = FitParam("Frequency", 1.2, 0.3, 3.0, logscale=True)
    params = [a, b]
    values = guifit(x, y, fit, params, xlabel="Time (s)", ylabel="Power (a.u.)")

    print(values)
    print([param.value for param in params])


if __name__ == "__main__":
    test_fit()
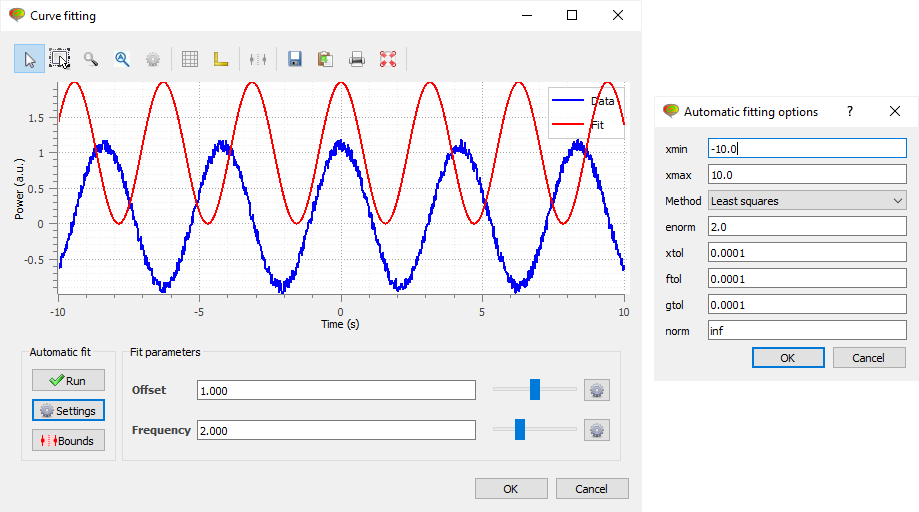
Image visualization
Image contrast adjustment
import os
import os.path as osp

import numpy as np
from guidata.env import execenv
from guidata.qthelpers import qt_app_context

from plotpy.builder import make
from plotpy.tests import get_path
from plotpy.tests.data import gen_image1, gen_image4


def __create_dialog_with_contrast(item):
    """Create plot dialog with contrast panel

    Args:
        Item: item to be added to the plot
    """
    win = make.dialog(
        edit=False,
        toolbar=True,
        wintitle="Contrast test",
        show_contrast=True,
        type="image",
        size=(600, 600),
    )
    plot = win.get_plot()
    plot.add_item(item)
    plot.set_active_item(item)
    item.unselect()
    win.show()
    return win


def test_contrast1():
    """Contrast test 1"""
    with qt_app_context(exec_loop=True):
        item = make.image(filename=get_path("brain.png"), colormap="gray")
        win = __create_dialog_with_contrast(item)
        fname = "contrast.png"
        try:
            win.get_plot().save_widget(fname)
        except IOError:
            # Skipping this part of the test
            # because user has no write permission on current directory
            pass
        if execenv.unattended and osp.isfile(fname):
            os.unlink(fname)


def test_contrast2():
    """Contrast test 2

    Test if level histogram is really removed when the associated image is removed from
    the plot (the validation is not automatic)
    """
    with qt_app_context(exec_loop=True):
        item1 = make.image(filename=get_path("brain.png"), colormap="gray")
        win = __create_dialog_with_contrast(item1)
        plot = win.get_plot()
        plot.del_item(item1)
        item2 = make.image(gen_image1())
        plot.add_item(item2)
        plot.set_active_item(item2)


def test_contrast3():
    """Contrast test 3

    Test if level histogram works properly when the image has a really high dynamic
    range (the validation is not automatic)
    """
    with qt_app_context(exec_loop=True):
        data = gen_image4(512, 512)
        data = np.fft.fftshift(np.fft.fft2(data)).real
        item = make.image(data, colormap="viridis", eliminate_outliers=2.0)
        _win = __create_dialog_with_contrast(item)


if __name__ == "__main__":
    test_contrast1()
    test_contrast2()
    test_contrast3()
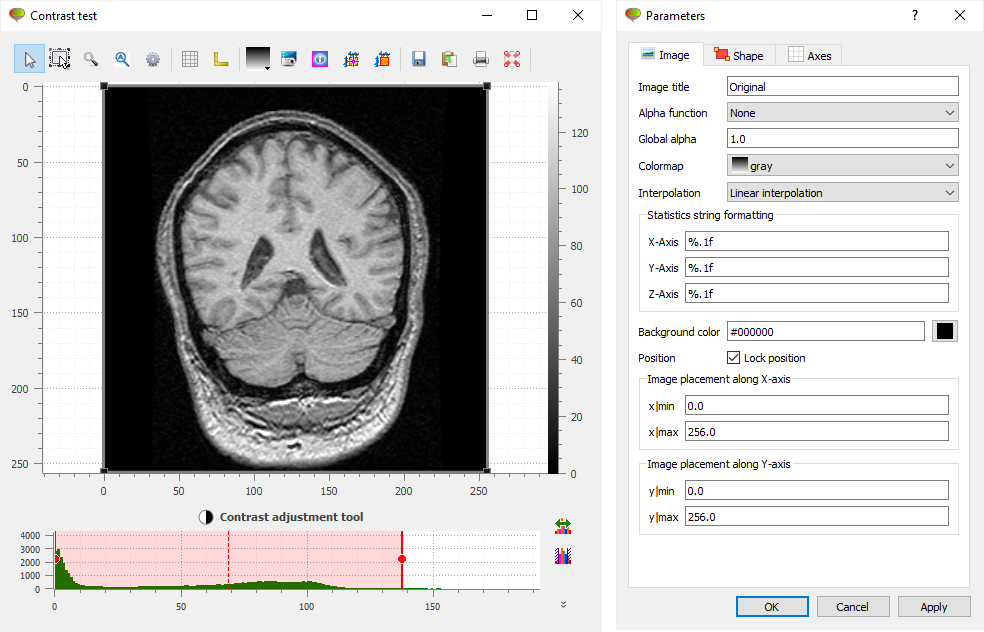
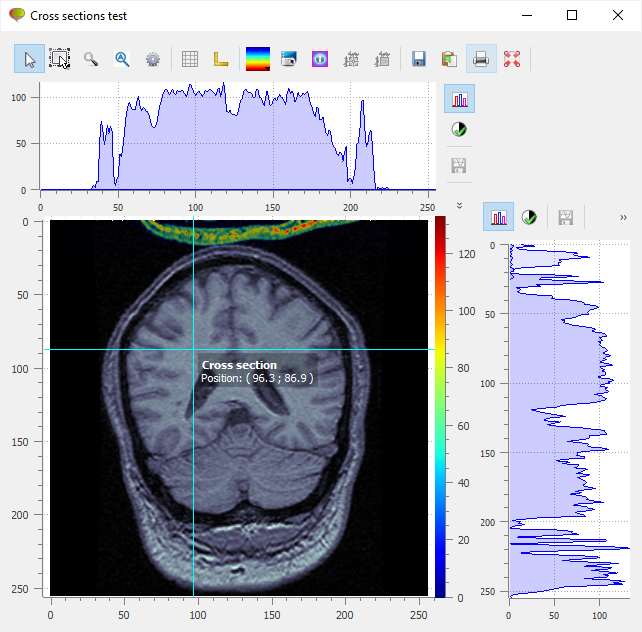
Image cross-sections
import numpy as np
from guidata.qthelpers import qt_app_context

from plotpy.builder import make
from plotpy.tests import get_path


def create_window():
    win = make.dialog(
        edit=False,
        toolbar=True,
        wintitle="Cross sections test",
        show_xsection=True,
        show_ysection=True,
        type="image",
        size=(640, 600),
    )
    return win


def test_cross_section():
    """Test cross section"""
    with qt_app_context(exec_loop=True):
        filename = get_path("brain.png")
        win = create_window()
        win.show()
        image = make.image(filename=filename, colormap="bone")
        data2 = np.array(image.data.T[200:], copy=True)
        image2 = make.image(data2, title="Modified", alpha_function="linear")
        plot = win.manager.get_plot()
        plot.add_item(image)
        plot.add_item(image2, z=1)


if __name__ == "__main__":
    test_cross_section()
Transformable images
Affine transforms example on 3000x3000 images (real-time transforms):
from __future__ import annotations

import os

import numpy as np
import pytest
from guidata.env import execenv
from guidata.qthelpers import qt_app_context
from qtpy import QtCore as QC
from qtpy import QtGui as QG

from plotpy import io
from plotpy.builder import make
from plotpy.constants import LUTAlpha
from plotpy.items import TrImageItem, assemble_imageitems
from plotpy.tests import vistools as ptv
from plotpy.tests.data import gen_image4

DEFAULT_CHARS = "".join([chr(c) for c in range(32, 256)])


def get_font_array(sz: int, chars: str = DEFAULT_CHARS) -> np.ndarray | None:
    """Return array of font characters

    Args:
        sz: Font size
        chars: Characters to include (default: all printable characters)

    Returns:
        Array of font characters
    """
    font = QG.QFont()
    font.setFixedPitch(True)
    font.setPixelSize(sz)
    font.setStyleStrategy(QG.QFont.NoAntialias)
    dummy = QG.QImage(10, 10, QG.QImage.Format_ARGB32)
    pnt = QG.QPainter(dummy)
    pnt.setFont(font)
    metric = pnt.fontMetrics()
    rct = metric.boundingRect(chars)
    pnt.end()
    h, w = rct.height(), rct.width()
    img = QG.QImage(w, h, QG.QImage.Format_ARGB32)
    paint = QG.QPainter()
    paint.begin(img)
    paint.setFont(font)
    paint.setBrush(QG.QColor(255, 255, 255))
    paint.setPen(QG.QColor(255, 255, 255))
    paint.drawRect(0, 0, w + 1, h + 1)
    paint.setPen(QG.QColor(0, 0, 0))
    paint.setBrush(QG.QColor(0, 0, 0))
    paint.drawText(0, paint.fontMetrics().ascent(), chars)
    paint.end()
    try:
        data = img.bits().asstring(h * w * 4)
    except AttributeError:
        data = img.bits()
    npy: np.ndarray = np.frombuffer(data, np.uint8)
    return npy.reshape(h, w, 4)[:, :, 0]


def write_text_on_array(
    data: np.ndarray,
    x: int,
    y: int,
    sz: int,
    txt: str,
    range: tuple[int, int] | None = None,
) -> None:
    """Write text in image (in-place)

    Args:
        data: Image data
        x: X-coordinate of top-left corner
        y: Y-coordinate of top-left corner
        sz: Font size
        txt: Text to write
        range: Range of values to map to 0-255 (default: None)
    """
    arr = get_font_array(sz, txt)
    if arr is None:
        return
    if range is None:
        m, M = data.min(), data.max()
    else:
        m, M = range
    z = (float(M) - float(m)) * np.array(arr, float) / 255.0 + m
    arr = np.array(z, data.dtype)
    dy, dx = arr.shape
    data[y : y + dy, x : x + dx] = arr


def make_items(N: int) -> list[TrImageItem]:
    """Make test TrImageItem items

    Args:
        N: Image size (N x N)

    Returns:
        List of image items
    """
    data = gen_image4(N, N)
    m = data.min()
    M = data.max()
    items = [make.trimage(data, alpha_function=LUTAlpha.LINEAR, colormap="jet")]
    for dtype in (np.uint8, np.uint16, np.int8, np.int16):
        info = np.iinfo(dtype().dtype)  # pylint: disable=no-value-for-parameter
        s = float((info.max - info.min))
        a1 = s * (data - m) / (M - m)
        img = np.array(a1 + info.min, dtype)
        write_text_on_array(img, 0, 0, int(N / 15.0), dtype.__name__)
        items.append(make.trimage(img, colormap="jet"))
    nc = int(np.sqrt(len(items)) + 1.0)
    maxy, x, y = 0, 0, 0
    w = None
    for index, item in enumerate(items):
        h = item.boundingRect().height()
        if index % nc == 0:
            x = 0
            y += maxy
            maxy = h
        else:
            x += w
            maxy = max(maxy, h)
        w = item.boundingRect().width()
        item.set_transform(x, y, 0.0)
        # item.set_selectable(False)
    return items


def save_image(name: str, data: np.ndarray) -> None:
    """Save image to file

    Args:
        name: Base name of file
        data: Image data
    """
    for fname in (name + ".u16.tif", name + ".u8.png"):
        if os.path.exists(fname):
            os.remove(fname)
    size = int(data.nbytes / 1024.0)
    print(f"Saving image: {data.shape[0]} x {data.shape[1]} ({size} KB):")
    print(" --> uint16")
    io.imwrite(name + ".u16.tif", data, dtype=np.uint16, max_range=True)
    print(" --> uint8")
    io.imwrite(name + ".u8.png", data, dtype=np.uint8, max_range=True)


def get_bbox(items: list[TrImageItem]) -> QC.QRectF:
    """Get bounding box of items

    Args:
        items: List of image items

    Returns:
        Bounding box of items
    """
    rectf = QC.QRectF()
    for item in items:
        rectf = rectf.united(item.boundingRect())
    return rectf


def build_image(items: list[TrImageItem]) -> None:
    """Build image from items

    Args:
        items: List of image items
    """
    r = get_bbox(items)
    _x, _y, w, h = r.getRect()
    print("-" * 80)
    print(f"Assemble test1: {int(w)} x {int(h)}")
    dest = assemble_imageitems(items, r, w, h)
    if not execenv.unattended:
        save_image("test1", dest)
    print("-" * 80)
    print(f"Assemble test1: {int(w / 4)} x {int(h / 4)}")
    dest = assemble_imageitems(items, r, w / 4, h / 4)
    if not execenv.unattended:
        save_image("test2", dest)
    print("-" * 80)


@pytest.mark.parametrize("N", [500])
@pytest.mark.parametrize("assemble_images", [False, True])
def test_transform(N: int, assemble_images: bool) -> None:
    """Test image transforms

    Args:
        N: Image size (N x N)
        assemble_images: If True, assemble images (default: False)
    """
    with qt_app_context(exec_loop=True):
        items = make_items(N)
        _win = ptv.show_items(
            items,
            wintitle="Transform test ({}x{} images)".format(N, N),
            plot_type="image",
            show_itemlist=True,
            winsize=(1000, 600),
        )
    if assemble_images:
        build_image(items)


if __name__ == "__main__":
    test_transform(N=500, assemble_images=True)
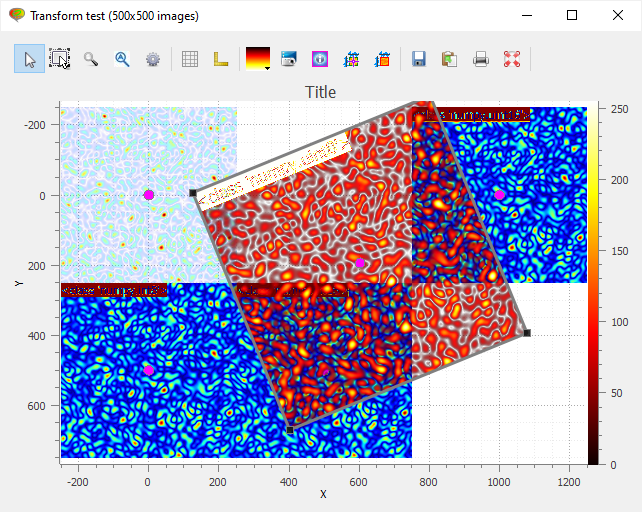
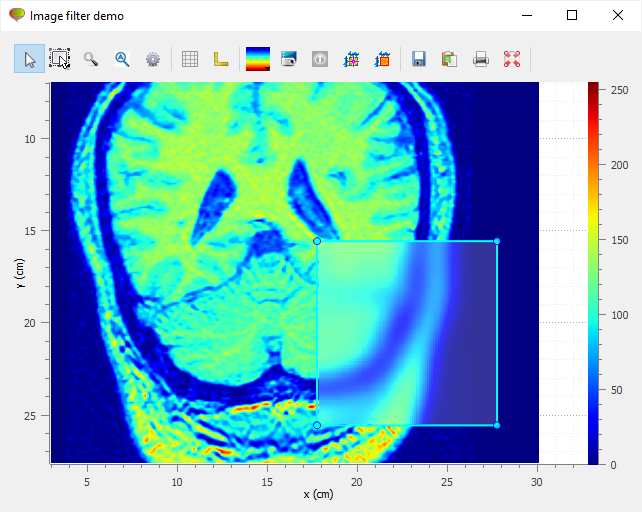
Image rectangular filter
import numpy as np
from guidata.qthelpers import qt_app_context
from scipy.ndimage import gaussian_filter

from plotpy import io
from plotpy.builder import make
from plotpy.tests import data as ptd
from plotpy.tests import get_path


def imshow(x, y, data, filter_area, yreverse=True):
    with qt_app_context(exec_loop=True):
        win = make.dialog(
            edit=False,
            toolbar=True,
            wintitle="Image filter demo",
            xlabel="x (cm)",
            ylabel="y (cm)",
            yreverse=yreverse,
            type="image",
            size=(800, 600),
        )
        image = make.xyimage(x, y, data)
        plot = win.manager.get_plot()
        plot.add_item(image)
        xmin, xmax, ymin, ymax = filter_area

        def ifilter(x, y, data):
            """Image filter function"""
            return gaussian_filter(data, 5)

        flt = make.imagefilter(xmin, xmax, ymin, ymax, image, filter=ifilter)
        plot.add_item(flt, z=1)
        plot.replot()
        win.show()


def test_imagefilter():
    """Test image filter"""
    x, y, data = ptd.gen_xyimage()
    imshow(x, y, data, filter_area=(-3.0, -1.0, 0.0, 2.0), yreverse=False)

    filename = get_path("brain.png")
    data = io.imread(filename, to_grayscale=True)
    x = np.linspace(0, 30.0, data.shape[1])
    y = np.linspace(0, 30.0, data.shape[0])
    imshow(x, y, data, filter_area=(10.0, 20.0, 5.0, 15.0))


if __name__ == "__main__":
    test_imagefilter()
Histograms
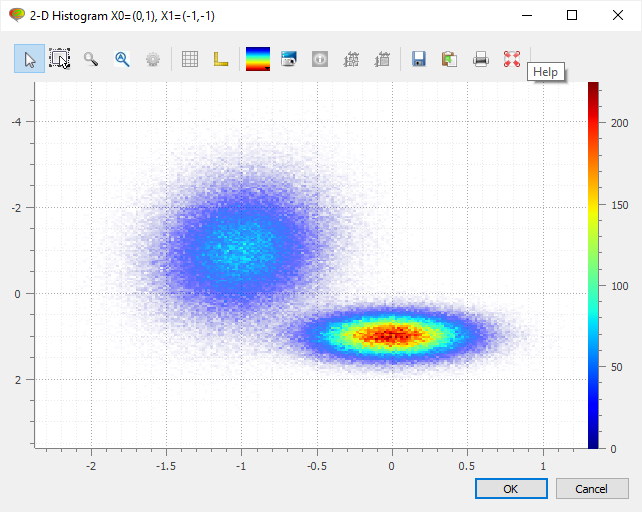
2-D histogram
from guidata.qthelpers import qt_app_context
from numpy import array, concatenate, dot, random

from plotpy.builder import make
from plotpy.config import _


def hist2d_func(X, Y, Z):
    with qt_app_context(exec_loop=True):
        win = make.dialog(
            edit=True,
            toolbar=True,
            wintitle="2-D Histogram X0=(0,1), X1=(-1,-1)",
            type="image",
        )
        hist2d = make.histogram2D(X, Y, 200, 200, Z=Z, computation=2)
        curve = make.curve(
            X[::50], Y[::50], linestyle="", marker="+", title=_("Markers")
        )
        plot = win.manager.get_plot()
        plot.set_aspect_ratio(lock=False)
        plot.set_antialiasing(False)
        plot.add_item(hist2d)
        plot.add_item(curve)
        plot.set_item_visible(curve, False)
        win.show()


def hist2d(X, Y):
    with qt_app_context(exec_loop=True):
        win = make.dialog(
            edit=True,
            toolbar=True,
            wintitle="2-D Histogram X0=(0,1), X1=(-1,-1)",
            type="image",
        )
        hist2d = make.histogram2D(X, Y, 200, 200)
        curve = make.curve(
            X[::50], Y[::50], linestyle="", marker="+", title=_("Markers")
        )
        plot = win.manager.get_plot()
        plot.set_aspect_ratio(lock=False)
        plot.set_antialiasing(False)
        plot.add_item(hist2d)
        plot.add_item(curve)
        plot.set_item_visible(curve, False)
        win.show()


def test_hist_2d():
    N = 150000
    m = array([[1.0, 0.2], [-0.2, 3.0]])
    X1 = random.normal(0, 0.3, size=(N, 2))
    X2 = random.normal(0, 0.3, size=(N, 2))
    X = concatenate((X1 + [0, 1.0], dot(X2, m) + [-1, -1.0]))
    hist2d(X[:, 0], X[:, 1])


def test_hist_2d_func():
    N = 150000
    m = array([[1.0, 0.2], [-0.2, 3.0]])
    X1 = random.normal(0, 0.3, size=(N, 2))
    X2 = random.normal(0, 0.3, size=(N, 2))
    X = concatenate((X1 + [0, 1.0], dot(X2, m) + [-1, -1.0]))
    hist2d_func(X[:, 0], X[:, 1], X[:, 0] + X[:, 1])


if __name__ == "__main__":
    test_hist_2d()
    test_hist_2d_func()
Other examples
Dot Array Demo
from __future__ import annotations

from typing import TYPE_CHECKING

import guidata.dataset as gds
import guidata.dataset.qtwidgets as gdq
import numpy as np
from guidata.configtools import get_image_file_path
from guidata.qthelpers import qt_app_context
from qtpy import QtCore as QC
from qtpy import QtGui as QG
from qtpy import QtWidgets as QW

import plotpy.config  # Loading icons  # noqa: F401
from plotpy.interfaces import IImageItemType
from plotpy.items import RawImageItem
from plotpy.items.curve.errorbar import vmap
from plotpy.plot import PlotDialog, PlotOptions
from plotpy.styles import RawImageParam
from plotpy.tools import CopyToClipboardTool, HelpTool, PrintTool, SaveAsTool

if TYPE_CHECKING:
    from plotpy.interfaces import IItemType


class DotArrayParam(gds.DataSet):
    """Dot array"""

    def _update_cb(self, *args):
        """Update callback, to be overriden"""
        pass

    g1 = gds.BeginGroup("Size of the area")
    dim_h = gds.FloatItem("Width", default=20.0, min=0.0, unit="mm")
    dim_v = gds.FloatItem("Height", default=20.0, min=0.0, unit="mm")
    _g1 = gds.EndGroup("Size of the area")

    g2 = gds.BeginGroup("Grid pattern properties")
    step_x = gds.FloatItem("Step in X-axis", default=1.0, min=1.0, unit="mm")
    step_y = gds.FloatItem("Step in Y-axis", default=1.0, min=1.0, unit="mm")
    size = gds.FloatItem(
        "Dot size", default=0.2, min=0.0, max=2.0, slider=True, unit="mm"
    )
    color = gds.ColorItem("Dot color", default="red")
    _g2 = gds.EndGroup("Grid pattern properties")

    def update_item(self, obj):
        """Update item from parameters"""
        self._update_cb()

    def update_param(self, obj):
        """Update parameters from object"""
        pass


class DotArrayRawImageParam(RawImageParam, DotArrayParam):
    pass


class DotArrayItem(RawImageItem):
    """Dot array item"""

    def __init__(self, param=None):
        super().__init__(np.zeros((1, 1)), param)
        self.update_border()

    def boundingRect(self):
        """Reimplemented to return the bounding rectangle of the item"""
        param = self.param
        if param is not None:
            return QC.QRectF(
                QC.QPointF(-0.5 * param.size, -0.5 * param.size),
                QC.QPointF(
                    param.dim_h + 0.5 * param.size, param.dim_v + 0.5 * param.size
                ),
            )

    def types(self) -> tuple[type[IItemType], ...]:
        """Returns a group or category for this item.
        This should be a tuple of class objects inheriting from IItemType

        Returns:
            tuple: Tuple of class objects inheriting from IItemType
        """
        return (IImageItemType,)

    def draw_image(self, painter, canvasRect, srcRect, dstRect, xMap, yMap):
        """Draw image"""
        if self.warn_if_non_linear_scale(painter, canvasRect):
            return
        painter.setRenderHint(QG.QPainter.Antialiasing, True)
        param = self.param
        xcoords = vmap(xMap, np.arange(0, param.dim_h + 1, param.step_x))
        ycoords = vmap(yMap, np.arange(0, param.dim_v + 1, param.step_y))
        rx = 0.5 * param.size * xMap.pDist() / xMap.sDist()
        ry = 0.5 * param.size * yMap.pDist() / yMap.sDist()
        color = QG.QColor(param.color)
        painter.setPen(QG.QPen(color))
        painter.setBrush(QG.QBrush(color))
        for xc in xcoords:
            for yc in ycoords:
                painter.drawEllipse(QC.QPointF(xc, yc), rx, ry)


class CustomHelpTool(HelpTool):
    """Custom help tool"""

    def activate_command(self, plot, checked):
        """Activate command"""
        QW.QMessageBox.information(
            plot,
            "Help",
            """**to be customized**
Keyboard/mouse shortcuts:
  - single left-click: item (curve, image, ...) selection
  - single right-click: context-menu relative to selected item
  - shift: on-active-curve (or image) cursor
  - alt: free cursor
  - left-click + mouse move: move item (when available)
  - middle-click + mouse move: pan
  - right-click + mouse move: zoom""",
        )


class DotArrayDialog(PlotDialog):
    """Dot array dialog"""

    def __init__(self):
        self.item = None
        self.stamp_gbox = None
        super().__init__(
            title="Dot array example",
            options=PlotOptions(title="Main plot", type="image"),
            toolbar=True,
            edit=True,
        )
        self.resize(900, 600)

    def register_tools(self):
        """Register tools"""
        manager = self.plot_widget.manager
        manager.register_standard_tools()
        manager.add_separator_tool()
        manager.add_tool(SaveAsTool)
        manager.add_tool(CopyToClipboardTool)
        manager.add_tool(PrintTool)
        manager.add_tool(CustomHelpTool)
        manager.activate_default_tool()
        plot = manager.get_plot()
        plot.enableAxis(plot.yRight, False)
        plot.set_aspect_ratio(lock=True)

    def populate_plot_layout(self):
        """Populate the plot layout

        Reimplements the method from PlotDialog"""
        self.add_widget(self.plot_widget, row=0, column=0, rowspan=3, columnspan=1)
        logo_path = get_image_file_path("plotpy.svg")
        logo = QW.QLabel()
        logo.setPixmap(QG.QPixmap(logo_path))
        logo.setAlignment(QC.Qt.AlignCenter)
        self.add_widget(logo, 1, 1)
        logo_txt = QW.QLabel("Powered by <b>plotpy</b>")
        logo_txt.setAlignment(QC.Qt.AlignHCenter | QC.Qt.AlignTop)
        self.add_widget(logo_txt, 2, 1)
        self.stamp_gbox = gdq.DataSetEditGroupBox("Dots", DotArrayParam)
        self.stamp_gbox.SIG_APPLY_BUTTON_CLICKED.connect(self.apply_params)
        self.add_widget(self.stamp_gbox, 0, 1)

    def show_data(self, param):
        """Show data"""
        plot = self.plot_widget.plot
        if self.item is None:
            itemparam = DotArrayRawImageParam()
            gds.update_dataset(itemparam, param)
            param._update_cb = lambda: self.stamp_gbox.get()
            self.item = DotArrayItem(itemparam)
            plot.add_item(self.item)
        else:
            gds.update_dataset(self.item.param, param)
            self.item.update_border()
        plot.do_autoscale()

    def apply_params(self):
        """Apply parameters"""
        param = self.stamp_gbox.dataset
        self.show_data(param)


def test_dot_array():
    """Test dot array dialog"""
    with qt_app_context(exec_loop=True):
        dlg = DotArrayDialog()
        dlg.apply_params()
        dlg.show()


if __name__ == "__main__":
    test_dot_array()
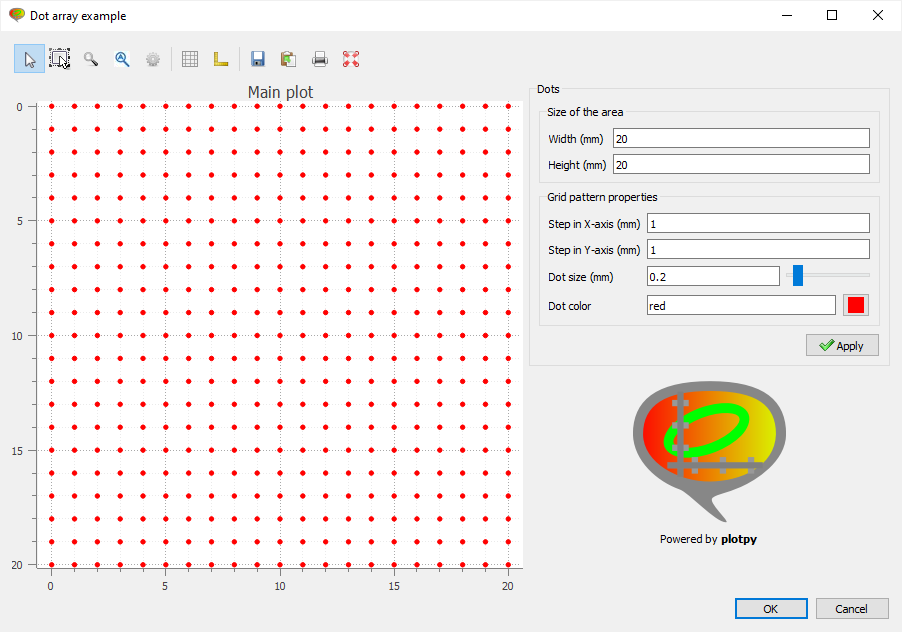
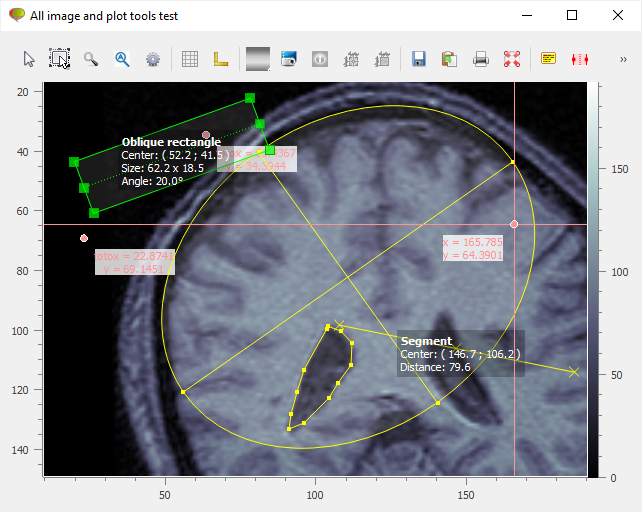
Image plot tools
from guidata.qthelpers import qt_app_context
from qtpy import QtWidgets as QW

from plotpy.builder import make
from plotpy.items import Marker
from plotpy.tests import get_path
from plotpy.tools import (
    AnnotatedCircleTool,
    AnnotatedEllipseTool,
    AnnotatedObliqueRectangleTool,
    AnnotatedPointTool,
    AnnotatedPolygonTool,
    AnnotatedRectangleTool,
    AnnotatedSegmentTool,
    CircleTool,
    EllipseTool,
    HCursorTool,
    HRangeTool,
    LabelTool,
    MultiLineTool,
    ObliqueRectangleTool,
    PlaceAxesTool,
    PolygonTool,
    RectangleTool,
    SegmentTool,
    VCursorTool,
    XCursorTool,
)

TOOLBAR_ID = "toolbar2"


def create_window():
    win = make.dialog(
        edit=False,
        toolbar=True,
        wintitle="All image and plot tools test",
        type="image",
        size=(800, 600),
    )
    toolbar2 = QW.QToolBar()
    win.layout().addWidget(toolbar2)
    win.manager.add_toolbar(toolbar2, TOOLBAR_ID)

    for toolklass in (
        LabelTool,
        HRangeTool,
        VCursorTool,
        HCursorTool,
        XCursorTool,
        SegmentTool,
        RectangleTool,
        ObliqueRectangleTool,
        CircleTool,
        EllipseTool,
        MultiLineTool,
        PolygonTool,
        PlaceAxesTool,
        AnnotatedRectangleTool,
        AnnotatedObliqueRectangleTool,
        AnnotatedCircleTool,
        AnnotatedEllipseTool,
        AnnotatedSegmentTool,
        AnnotatedPointTool,
        AnnotatedPolygonTool,
    ):
        win.manager.add_tool(toolklass, toolbar_id=TOOLBAR_ID)
    return win


def test_image_plot_tools():
    """Test"""
    with qt_app_context(exec_loop=True):
        filename = get_path("brain.png")
        win = create_window()
        win.show()
        image = make.image(filename=filename, colormap="bone")
        plot = win.manager.get_plot()
        plot.add_item(image)
        title = "toto"
        marker1 = Marker(label_cb=lambda x, y: f"{title}x = {x:g}<br>y = {y:g}")
        plot.add_item(marker1)
        marker2 = Marker(label_cb=lambda x, y: f"{title}x = {x:g}<br>y = {y:g}")
        plot.add_item(marker2)


if __name__ == "__main__":
    test_image_plot_tools()
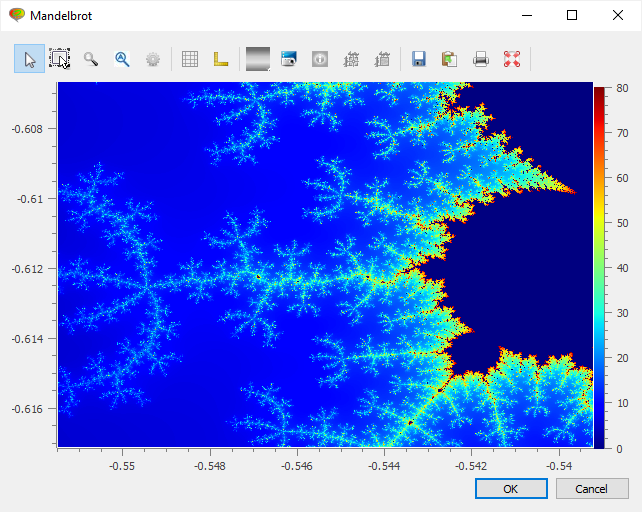
Real-time Mandelbrot plotting
import numpy as np
from guidata.qthelpers import qt_app_context
from qtpy import QtCore as QC

from plotpy.builder import make
from plotpy.config import _
from plotpy.items import RawImageItem
from plotpy.mandelbrot import mandelbrot
from plotpy.tools import ToggleTool


class FullScale(ToggleTool):
    def __init__(self, parent, image):
        super().__init__(parent, _("MAX resolution"), None)
        self.image = image
        self.minprec = image.IMAX
        self.maxprec = 5 * image.IMAX

    def activate_command(self, plot, checked):
        if self.image.IMAX == self.minprec:
            self.image.IMAX = self.maxprec
        else:
            self.image.IMAX = self.minprec
        self.image.set_lut_range([0, self.image.IMAX])
        plot.replot()

    def update_status(self, plot):
        self.action.setChecked(self.image.IMAX == self.maxprec)


class MandelItem(RawImageItem):
    def __init__(self, xmin, xmax, ymin, ymax):
        super().__init__(np.zeros((1, 1), np.uint8))
        self.bounds = QC.QRectF(QC.QPointF(xmin, ymin), QC.QPointF(xmax, ymax))
        self.update_border()
        self.IMAX = 80
        self.set_lut_range([0, self.IMAX])

    # ---- QwtPlotItem API ------------------------------------------------------
    def draw_image(self, painter, canvasRect, srcRect, dstRect, xMap, yMap):
        if self.warn_if_non_linear_scale(painter, canvasRect):
            return
        x1, y1, x2, y2 = canvasRect.toAlignedRect().getCoords()
        i1, j1, i2, j2 = srcRect

        NX = x2 - x1
        NY = y2 - y1
        if self.data.shape != (NX, NY):
            self.data = np.zeros((NY, NX), np.int16)
        mandelbrot(i1, j1, i2, j2, self.data, self.IMAX)

        srcRect = (0, 0, NX, NY)
        x1, y1, x2, y2 = canvasRect.toAlignedRect().getCoords()
        RawImageItem.draw_image(
            self, painter, canvasRect, srcRect, (x1, y1, x2, y2), xMap, yMap
        )


def create_mandelbrot_window():
    """Create a Mandelbrot set window"""
    win = make.window(
        toolbar=True,
        wintitle="Mandelbrot",
        yreverse=False,
        type="image",
    )
    mandel = MandelItem(-1.5, 0.5, -1.0, 1.0)
    fstool = win.manager.add_tool(FullScale, mandel)
    plot = win.get_plot()
    plot.set_aspect_ratio(lock=False)
    plot.add_item(mandel)
    return win, mandel, fstool


def test_mandel():
    """Test Mandelbrot set window"""
    with qt_app_context(exec_loop=True):
        win, _mandel, _fstool = create_mandelbrot_window()
        win.show()


if __name__ == "__main__":
    test_mandel()
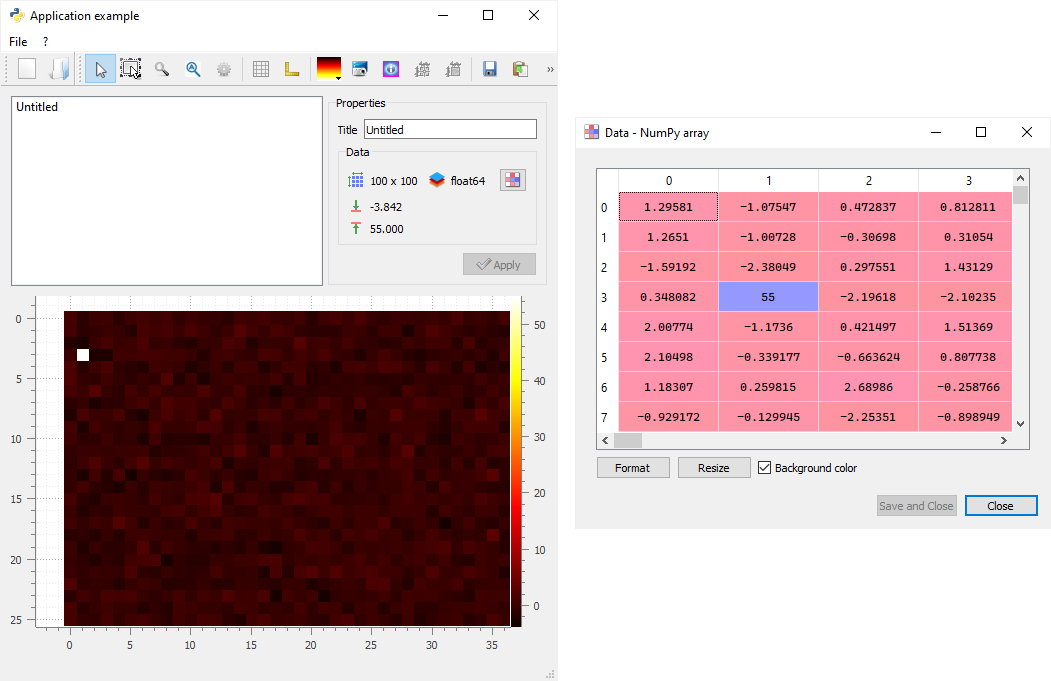
Simple application
import sys

import numpy as np
from guidata.configtools import get_icon
from guidata.dataset import (
    ChoiceItem,
    DataSet,
    FloatArrayItem,
    GetAttrProp,
    IntItem,
    StringItem,
    update_dataset,
)
from guidata.dataset.qtwidgets import DataSetEditGroupBox
from guidata.qthelpers import (
    add_actions,
    create_action,
    get_std_icon,
    qt_app_context,
    win32_fix_title_bar_background,
)
from qtpy import QtCore as QC
from qtpy import QtWidgets as QW

from plotpy import io
from plotpy.builder import make
from plotpy.config import _
from plotpy.plot import PlotOptions, PlotWidget
from plotpy.tests import get_path
from plotpy.widgets import about


class ImageParam(DataSet):
    _hide_data = False
    _hide_size = True
    title = StringItem(_("Title"), default=_("Untitled"))
    data = FloatArrayItem(_("Data")).set_prop("display", hide=GetAttrProp("_hide_data"))
    width = IntItem(
        _("Width"), help=_("Image width (pixels)"), min=1, default=100
    ).set_prop("display", hide=GetAttrProp("_hide_size"))
    height = IntItem(
        _("Height"), help=_("Image height (pixels)"), min=1, default=100
    ).set_prop("display", hide=GetAttrProp("_hide_size"))


class ImageParamNew(ImageParam):
    _hide_data = True
    _hide_size = False
    type = ChoiceItem(_("Type"), (("rand", _("random")), ("zeros", _("zeros"))))


class ImageListWithProperties(QW.QSplitter):
    def __init__(self, parent):
        QW.QSplitter.__init__(self, parent)
        self.imagelist = QW.QListWidget(self)
        self.addWidget(self.imagelist)
        self.properties = DataSetEditGroupBox(_("Properties"), ImageParam)
        self.properties.setEnabled(False)
        self.addWidget(self.properties)


class CentralWidget(QW.QSplitter):
    def __init__(self, parent, toolbar):
        QW.QSplitter.__init__(self, parent)
        self.setContentsMargins(10, 10, 10, 10)
        self.setOrientation(QC.Qt.Vertical)

        imagelistwithproperties = ImageListWithProperties(self)
        self.addWidget(imagelistwithproperties)
        self.imagelist = imagelistwithproperties.imagelist
        self.imagelist.currentRowChanged.connect(self.current_item_changed)
        self.imagelist.itemSelectionChanged.connect(self.selection_changed)
        self.properties = imagelistwithproperties.properties
        self.properties.SIG_APPLY_BUTTON_CLICKED.connect(self.properties_changed)

        self.plot_widget = PlotWidget(
            self,
            options=PlotOptions(type="image", show_contrast=True),
            auto_tools=False,
        )
        self.plot_widget.plot.SIG_LUT_CHANGED.connect(self.lut_range_changed)
        self.item = None  # image item

        self.plot_widget.manager.add_toolbar(toolbar, "default")
        self.plot_widget.register_tools()

        self.addWidget(self.plot_widget)

        self.images = []  # List of ImageParam instances
        self.lut_ranges = []  # List of LUT ranges

        self.setStretchFactor(0, 0)
        self.setStretchFactor(1, 1)
        self.setHandleWidth(10)
        self.setSizes([1, 2])

    def refresh_list(self):
        """Refresh image list"""
        self.imagelist.clear()
        self.imagelist.addItems([image.title for image in self.images])

    def selection_changed(self):
        """Image list: selection changed"""
        row = self.imagelist.currentRow()
        self.properties.setDisabled(row == -1)

    def current_item_changed(self, row):
        """Image list: current image changed"""
        if row == -1:
            return
        image, lut_range = self.images[row], self.lut_ranges[row]
        self.show_data(image.data, lut_range)
        update_dataset(self.properties.dataset, image)
        self.properties.get()

    def lut_range_changed(self):
        """LUT range changed"""
        row = self.imagelist.currentRow()
        self.lut_ranges[row] = self.item.get_lut_range()

    def show_data(self, data, lut_range=None):
        """Show image data"""
        plot = self.plot_widget.plot
        if self.item is not None:
            self.item.set_data(data)
            if lut_range is None:
                lut_range = self.item.get_lut_range()
            self.plot_widget.manager.set_contrast_range(*lut_range)
            self.plot_widget.manager.update_cross_sections()
        else:
            self.item = make.image(data, interpolation="nearest")
            plot.add_item(self.item, z=0)
        plot.select_item(self.item)
        plot.do_autoscale()
        plot.replot()

    def properties_changed(self):
        """The properties 'Apply' button was clicked: updating image"""
        row = self.imagelist.currentRow()
        image = self.images[row]
        update_dataset(image, self.properties.dataset)
        self.refresh_list()
        self.show_data(image.data)

    def add_image(self, image):
        """Add image"""
        self.images.append(image)
        self.lut_ranges.append(None)
        self.refresh_list()
        self.imagelist.setCurrentRow(len(self.images) - 1)
        plot = self.plot_widget.plot
        plot.do_autoscale()

    def add_image_from_file(self, filename):
        """Add image from file"""
        image = ImageParam()
        image.title = str(filename)
        image.data = io.imread(filename, to_grayscale=True)
        image.height, image.width = image.data.shape
        self.add_image(image)

    def remove_image(self, index=None):
        """Remove image"""
        if index is None:
            index = self.imagelist.currentRow()
        del self.images[index]
        del self.lut_ranges[index]
        self.refresh_list()
        if self.imagelist.count() > 0:
            self.imagelist.setCurrentRow(0)
        else:
            self.item = None
            self.plot_widget.plot.del_all_items()
            self.plot_widget.plot.replot()


class MainWindow(QW.QMainWindow):
    """Main Window"""

    def __init__(self):
        super().__init__()
        win32_fix_title_bar_background(self)
        self.setup()

    def setup(self):
        """Setup window parameters"""
        self.setWindowIcon(get_icon("python.png"))
        self.setWindowTitle(_("Application example"))
        self.resize(QC.QSize(600, 800))

        # Welcome message in statusbar:
        status = self.statusBar()
        status.showMessage(_("Welcome to plotpy application example!"), 5000)

        # Set central widget:
        main_toolbar = self.addToolBar("Main")
        toolbar = self.addToolBar("Image")
        self.mainwidget = CentralWidget(self, toolbar)
        self.setCentralWidget(self.mainwidget)

        # File menu
        file_menu = self.menuBar().addMenu(_("File"))
        new_action = create_action(
            self,
            _("New..."),
            shortcut="Ctrl+N",
            icon=get_icon("filenew.png"),
            tip=_("Create a new image"),
            triggered=self.new_image,
        )
        open_action = create_action(
            self,
            _("Open..."),
            shortcut="Ctrl+O",
            icon=get_icon("fileopen.png"),
            tip=_("Open an image"),
            triggered=self.open_image,
        )
        quit_action = create_action(
            self,
            _("Quit"),
            shortcut="Ctrl+Q",
            icon=get_std_icon("DialogCloseButton"),
            tip=_("Quit application"),
            triggered=self.close,
        )
        add_actions(file_menu, (new_action, open_action, None, quit_action))

        # Edit menu
        edit_menu = self.menuBar().addMenu(_("Edit"))
        del_action = create_action(
            self,
            _("Delete"),
            shortcut="Del",
            icon=get_icon("editdelete.png"),
            tip=_("Delete selected image"),
            triggered=self.mainwidget.remove_image,
        )
        add_actions(edit_menu, (del_action,))

        # Help menu
        help_menu = self.menuBar().addMenu("?")
        about_action = create_action(
            self,
            _("About %s...") % "PlotPy",
            icon=get_std_icon("MessageBoxInformation"),
            triggered=about.show_about_dialog,
        )
        add_actions(help_menu, (about_action,))

        add_actions(main_toolbar, (new_action, open_action))

    # ------I/O
    def new_image(self, imagenew=None):
        """Create a new image"""
        if imagenew is None:
            imagenew = ImageParamNew(title=_("Create a new image"))
            if not imagenew.edit(self):
                return
        image = ImageParam()
        image.title = imagenew.title
        if imagenew.type == "zeros":
            image.data = np.zeros((imagenew.width, imagenew.height))
        elif imagenew.type == "rand":
            image.data = np.random.randn(imagenew.width, imagenew.height)
        self.mainwidget.add_image(image)

    def open_image(self, filename=None):
        """Open image file"""
        if filename is None:
            saved_in, saved_out, saved_err = sys.stdin, sys.stdout, sys.stderr
            sys.stdout = None
            filename, _filter = QW.QFileDialog.getOpenFileName(
                self,
                _("Open"),
                "",
                io.iohandler.get_filters("load"),
                "",
                options=QW.QFileDialog.ShowDirsOnly,
            )
            sys.stdin, sys.stdout, sys.stderr = saved_in, saved_out, saved_err
        if filename:
            self.mainwidget.add_image_from_file(filename)


def test_simple_window():
    """Test simple window"""
    with qt_app_context(exec_loop=True):
        window = MainWindow()
        window.show()
        window.new_image(imagenew=ImageParamNew.create(type="rand"))
        window.open_image(filename=get_path("brain.png"))


if __name__ == "__main__":
    test_simple_window()